In this guide, you will build a Network Operations Center (NOC) style monitoring dashboard similar to what ISPs use.
This setup allows you to monitor GPON / PON Stick telemetry using:
- Grafana – Visualization dashboard
- Prometheus – Metrics database
- Kitamon – GPON telemetry exporter
Once complete, you will have real-time monitoring for your ONU / PON stick.
Requirements
This guide assumes:
- Ubuntu Server (or any Debian-based distribution)
- Basic Linux terminal knowledge
- Internet connection
- NIJIKA PON Stick or ONT BOX with latest Package Release (>= 260314)
Notes:
localhostis used in examples. Replace it with your server IP if accessing remotely.- For Raspberry Pi, replace
amd64witharm64when downloading binaries. - Make sure your system is fully updated before starting.
sudo apt update
sudo apt upgrade -y
Install Grafana
Grafana will be used to visualize metrics collected by Prometheus.
Install dependencies
sudo apt install -y adduser libfontconfig1 muslDownload Grafana
wget https://dl.grafana.com/grafana/release/12.4.1/grafana_12.4.1_22846628243_linux_amd64.deb
Install Grafana
sudo dpkg -i grafana_12.4.1_22846628243_linux_amd64.deb
Run Grafana
sudo service grafana-server startVerify installation
Open your browser:
http://localhost:3000
Default login:
Username: admin
Password: admin
Install Prometheus
Prometheus will collect and store metrics from Kitamon.
Create Prometheus user
sudo useradd --no-create-home --shell /bin/false prometheus
Download Prometheus
wget https://github.com/prometheus/prometheus/releases/download/v3.10.0/prometheus-3.10.0.linux-amd64.tar.gz
Extract it:
sudo tar -xvf prometheus-3.10.0.linux-amd64.tar.gz -C /opt
sudo mv /opt/prometheus-* /opt/prometheus
Create directories
sudo mkdir -p /opt/prometheus/storage
sudo mkdir -p /opt/prometheus/consoles
sudo mkdir -p /opt/prometheus/console_libraries
Set permissions:
sudo chown -R prometheus:prometheus /opt/prometheus
Create Prometheus service
Create the systemd service:
sudo nano /etc/systemd/system/prometheus.service
Paste the following configuration:
[Unit]
Description=Prometheus Monitoring
Wants=network-online.target
After=network-online.target

[Service]
User=prometheus
Group=prometheus
Type=simple

ExecStart=/opt/prometheus/prometheus \
  --config.file=/opt/prometheus/prometheus.yml \
  --storage.tsdb.path=/opt/prometheus/storage \
  --web.console.templates=/opt/prometheus/consoles \
  --web.console.libraries=/opt/prometheus/console_libraries

Restart=always

[Install]
WantedBy=multi-user.target
Start Prometheus
Reload systemd:
sudo systemctl daemon-reload
Enable Prometheus on boot:
sudo systemctl enable prometheus
Start Prometheus:
sudo systemctl start prometheus
Verify Prometheus
Open:
http://localhost:9090/targets
If Prometheus is running correctly, the page should load successfully.
Install Kitamon (GPON Telemetry Exporter)
Kitamon is a translator between the PON stick and Prometheus. It converts GPON telemetry into Prometheus metrics.
Install Python environment
sudo apt install python3.12-venv
Download Kitamon
sudo mkdir -p /opt/kitamon
Download files:
sudo wget https://raw.githubusercontent.com/Anime4000/RTL960x/refs/heads/main/WebGui/kitamon/main.py -O /opt/kitamon/main.py
sudo wget https://raw.githubusercontent.com/Anime4000/RTL960x/refs/heads/main/WebGui/kitamon/requirements.txt -O /opt/kitamon/requirements.txtEnter directory:
cd /opt/kitamon
Set permission
sudo chown -R 1000:1000 .Create Python virtual environment
python3 -m venv venv
Activate it:
source venv/bin/activate
Install dependencies:
pip install -r requirements.txt
Exit venv
deactivateCreate Kitamon service
sudo nano /etc/systemd/system/kitamon.service
Paste the following:
[Unit]
Description=Kita Monitor GPON Telemetry Exporter
After=network-online.target
Wants=network-online.target

[Service]
User=1000
Group=1000
Type=simple

Environment="PYTHONUNBUFFERED=1"

WorkingDirectory=/opt/kitamon

ExecStart=/opt/kitamon/venv/bin/python3 /opt/kitamon/main.py

Restart=always
RestartSec=3

[Install]
WantedBy=multi-user.target
Start Kitamon
Reload systemd:
sudo systemctl daemon-reload
Enable the service:
sudo systemctl enable kitamon
Start Kitamon:
sudo systemctl start kitamon
Connect Kitamon to Prometheus
Edit the Prometheus configuration:
sudo nano /opt/prometheus/prometheus.yml
Replace the contents with:
global:
  scrape_interval: 5s

scrape_configs:
  - job_name: kitamon
    scrape_timeout: 3s
    metrics_path: /metrics

    static_configs:
      - targets:
        - 192.168.1.1

    relabel_configs:
      - source_labels: [__address__]
        target_label: __param_target

      - source_labels: [__param_target]
        target_label: instance

      - target_label: __address__
        replacement: 127.0.0.1:4000
You can add more
- targets:IP Address to point each NIJIKA ONT
Reload Prometheus
sudo systemctl restart prometheus
Verify metrics collection
Open (refresh few times if blank):
http://localhost:9090/targets
You should see:
job="kitamon"
This means Prometheus is successfully collecting metrics from Kitamon.
Connect Grafana to Prometheus
Open Grafana:
http://localhost:3000
Login:
admin / admin
Add Prometheus Data Source
Navigate to:
Connections
→ Data Sources
→ Add data source
→ Prometheus
Set the URL (use localhost if Grafana and Prometheus in same VM):
http://localhost:9090
Click:
Save & Test
Import Dashboard
Navigate to:
Dashboards
→ New
→ Import
Copy and Paste the JSON:
https://github.com/Anime4000/RTL960x/blob/main/WebGui/kitamon/grafana_import.json
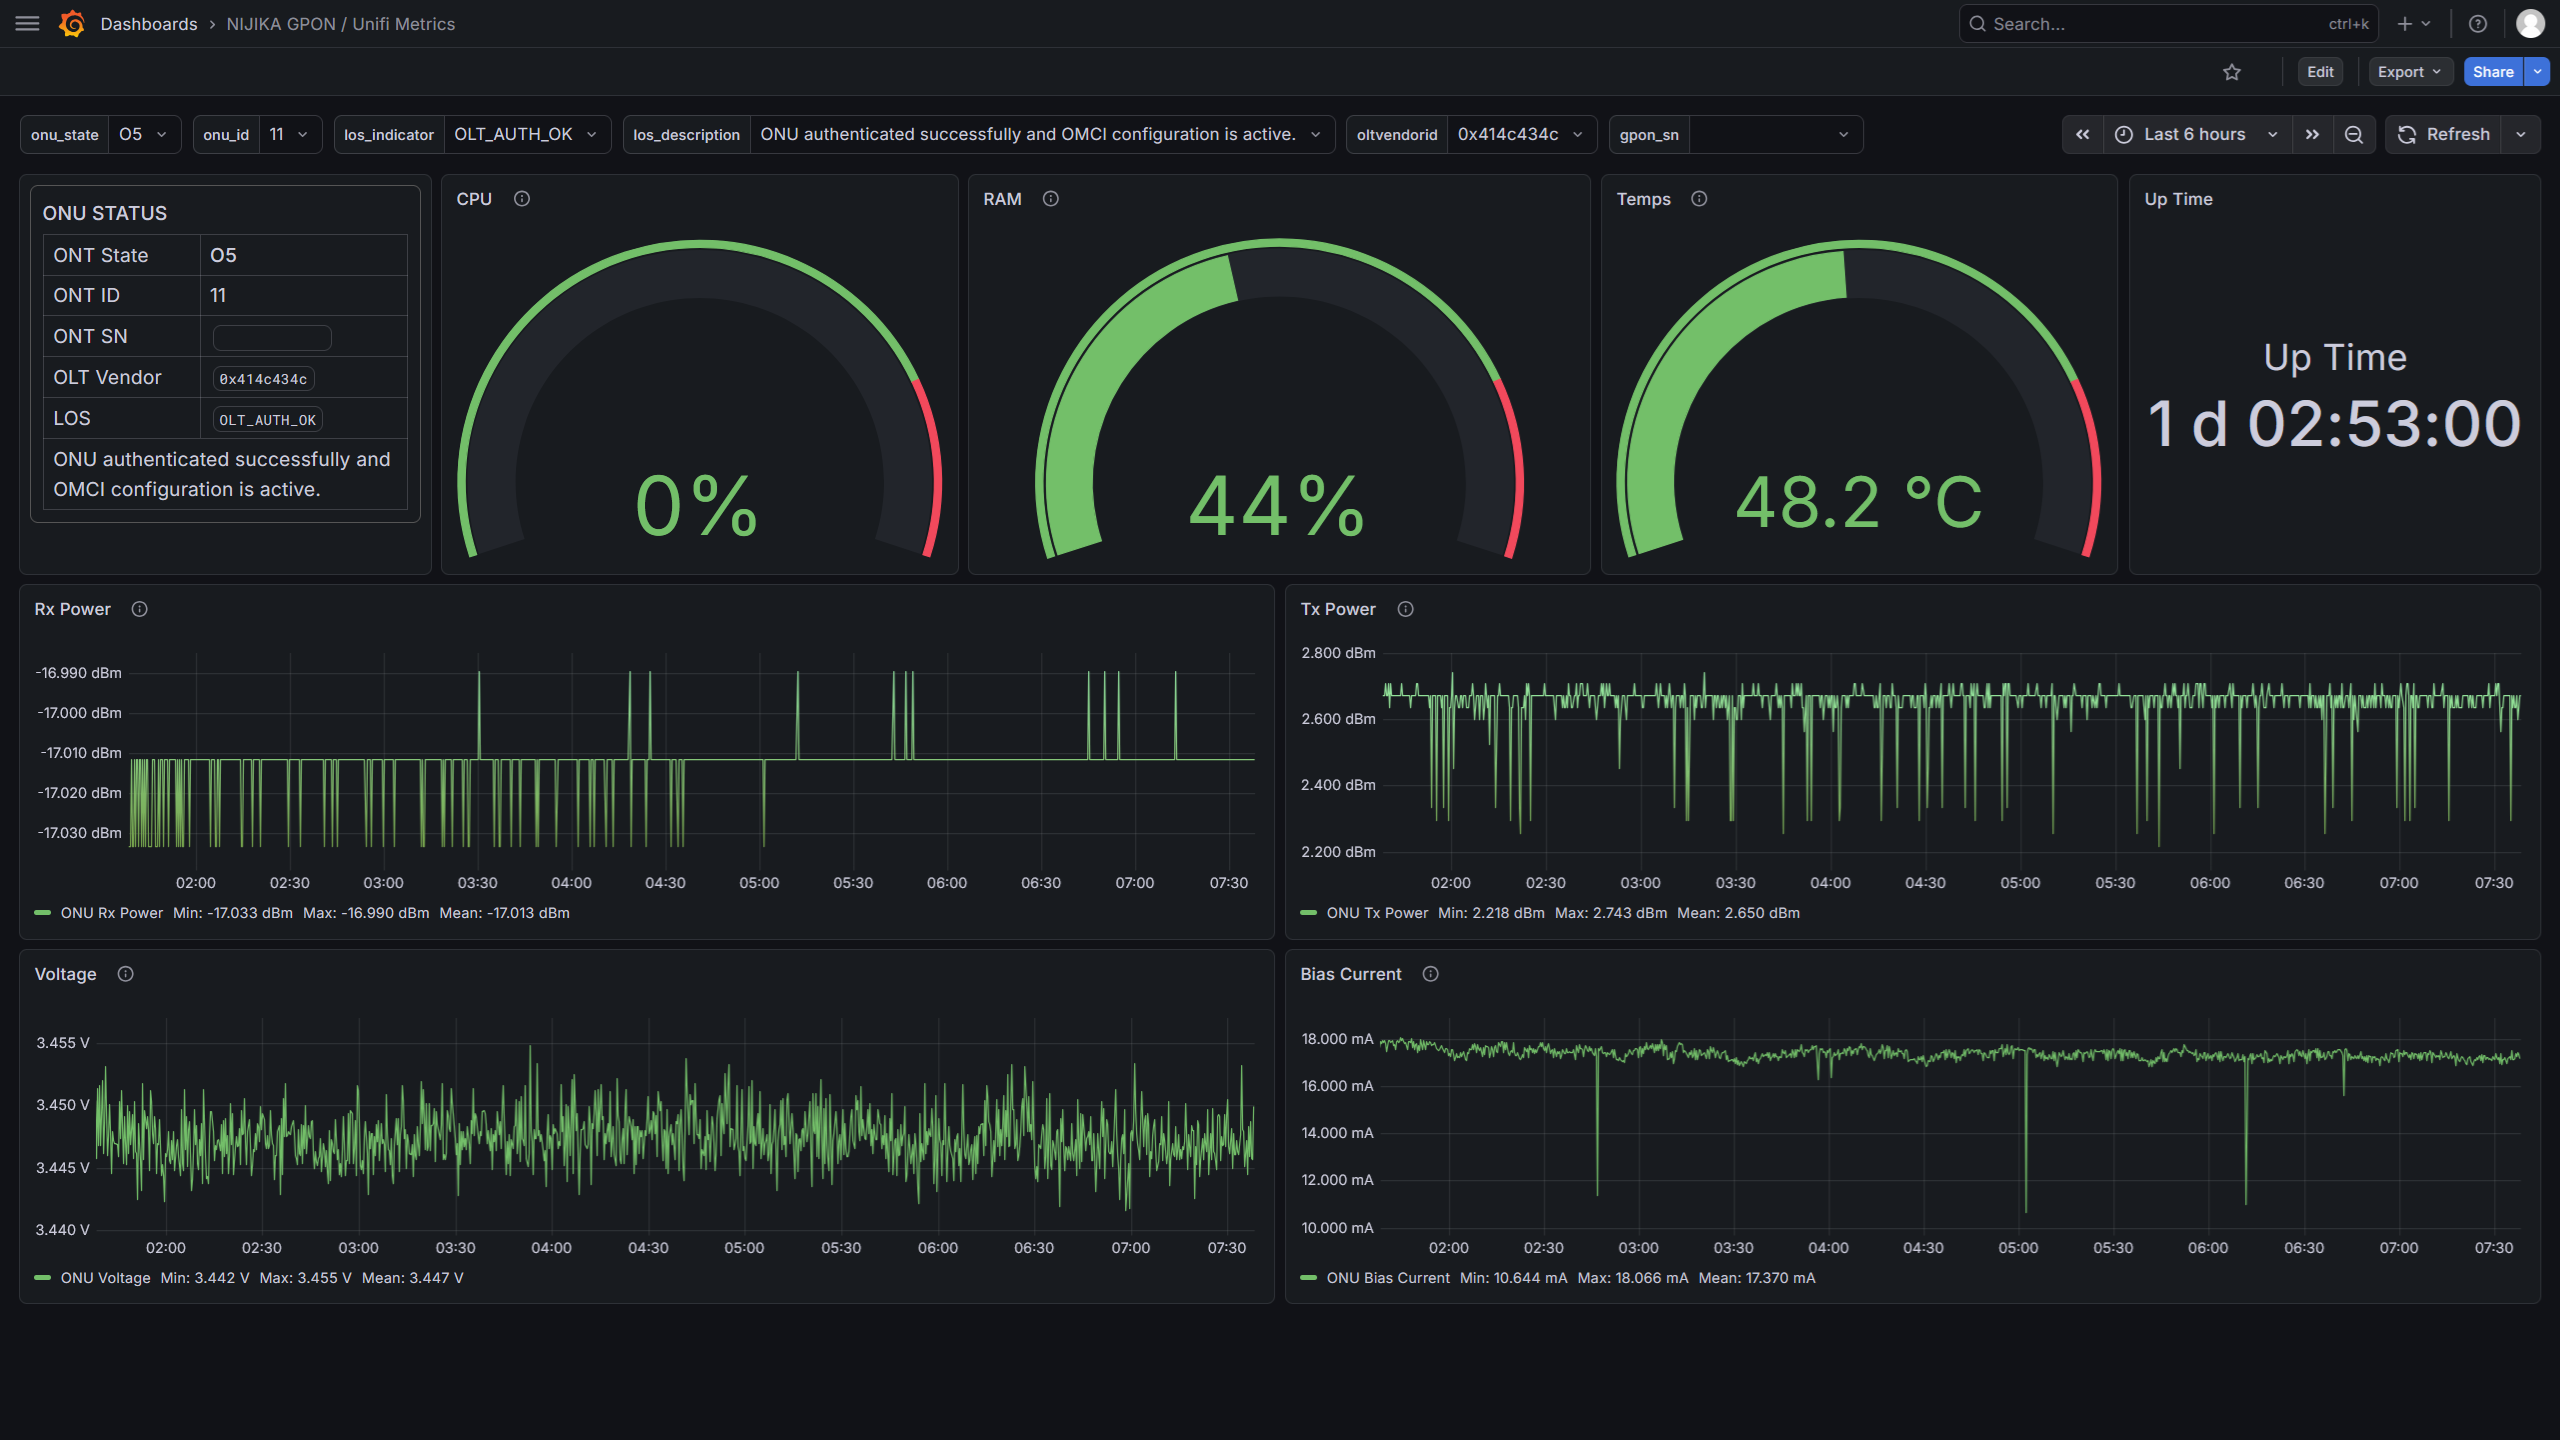
Once imported, you will have a complete GPON monitoring dashboard.
✅ You now have a NOC-style monitoring system for your GPON device.