In this guide, we will add network monitoring using ping checks.
This guide assumes you already have Prometheus and Grafana installed and running.
We will use Prometheus Blackbox Exporter to perform ICMP ping checks.
1. Download Blackbox Exporter
wget https://github.com/prometheus/blackbox_exporter/releases/download/v0.28.0/blackbox_exporter-0.28.0.linux-amd64.tar.gzExtract it to /opt.
sudo tar -xvf blackbox_exporter-0.28.0.linux-amd64.tar.gz -C /opt
sudo mv /opt/blackbox_exporter* /opt/blackbox_exporter
2. Set Permissions
If your Prometheus services run under the prometheus user, change ownership:
sudo chown -R prometheus:prometheus /opt/blackbox_exporter3. Allow ICMP (Ping) Permission
ICMP requires raw socket access. Grant the capability to the exporter binary:
sudo setcap cap_net_raw+ep /opt/blackbox_exporter/blackbox_exporterWithout this step, ping probes will fail with permission denied errors.
4. Create Blackbox Configuration
Edit the configuration file:
sudo nano /opt/blackbox_exporter/blackbox.ymlPaste the following configuration:
modules:
  icmp:
    prober: icmp
    timeout: 5s
This configuration enables ICMP probing for ping monitoring.
5. Create Systemd Service
Create a service so the exporter starts automatically.
sudo nano /etc/systemd/system/blackbox-exporter.servicePaste:
[Unit]
Description=Prometheus Blackbox Exporter
After=network.target

[Service]
User=prometheus
Group=prometheus
Type=simple
ExecStart=/opt/blackbox_exporter/blackbox_exporter \
  --config.file=/opt/blackbox_exporter/blackbox.yml \
  --web.listen-address=:9115

Restart=always

[Install]
WantedBy=multi-user.target
Reload systemd and start the service:
sudo systemctl daemon-reload
sudo systemctl enable blackbox-exporter.service
sudo systemctl start blackbox-exporter.service
Check if it is running:
systemctl status blackbox-exporterThe exporter should now be listening on:
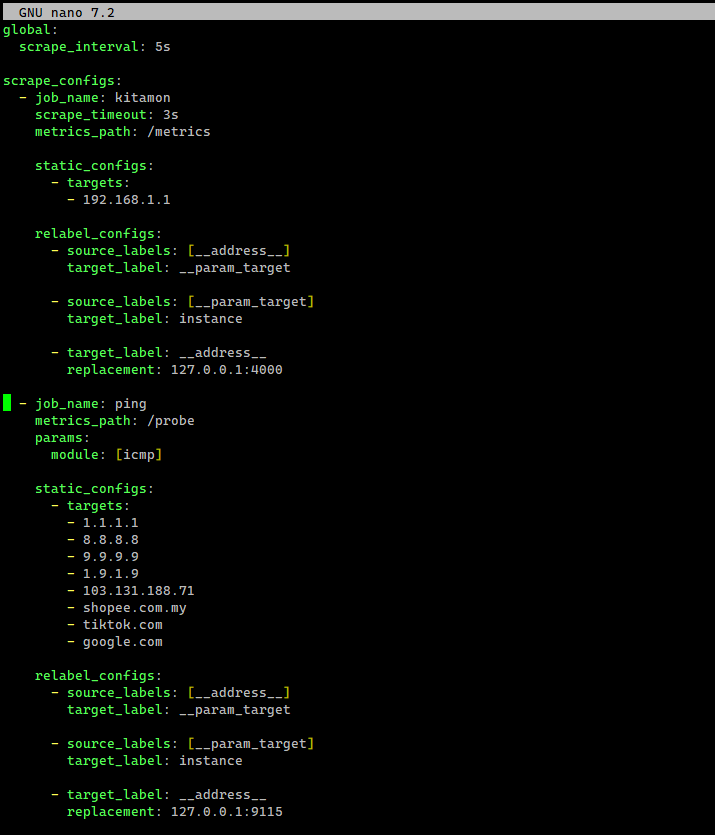
http://localhost:91156. Configure Prometheus
Edit your Prometheus configuration file:
sudo nano /opt/prometheus/prometheus.ymlAppend the following scrape configuration inside scrape_configs.
  - job_name: ping
    metrics_path: /probe
    params:
      module: [icmp]

    static_configs:
      - targets:
        - 1.1.1.1
        - 8.8.8.8

    relabel_configs:
      - source_labels: [__address__]
        target_label: __param_target

      - source_labels: [__param_target]
        target_label: instance

      - target_label: __address__
        replacement: 127.0.0.1:9115
Example:
7. Restart Prometheus
Restart the service so the new configuration is loaded.
sudo systemctl restart prometheus8. Verify Targets
Open the Prometheus targets page:
http://localhost:9090/targetsYou should see a new job named ping.
Example:
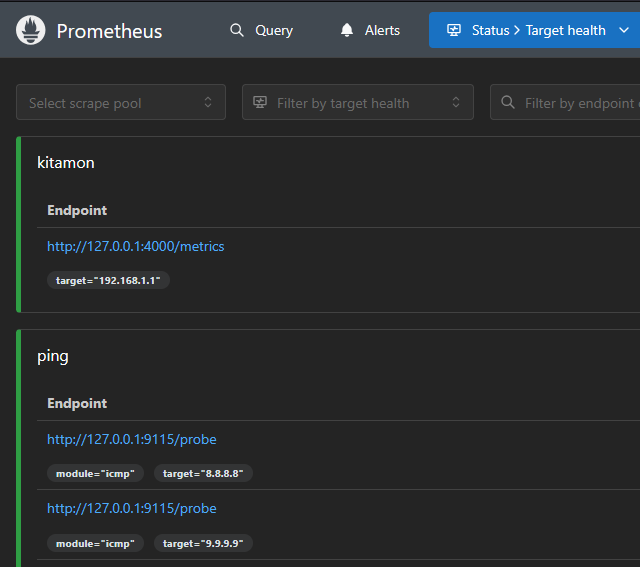
If everything is working correctly, the targets should show UP.
9. Add Ping Monitoring in Grafana
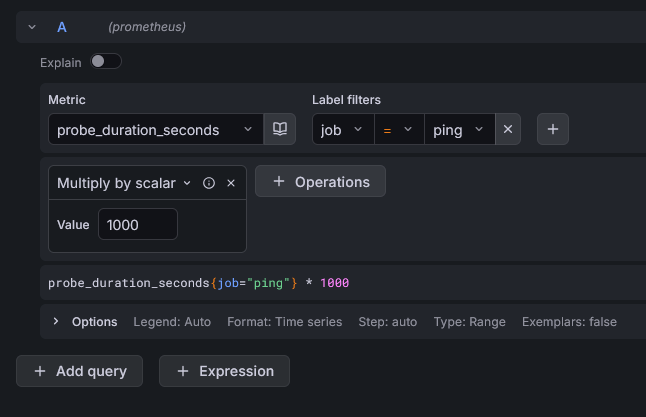
Now open Grafana and create a new visualization panel.
Create a Time series panel and use this query:
probe_duration_seconds{job="ping"} * 1000This converts latency from seconds to milliseconds.
Example:
10. Improve Label Display
To show clean labels in the legend, use field override like this:
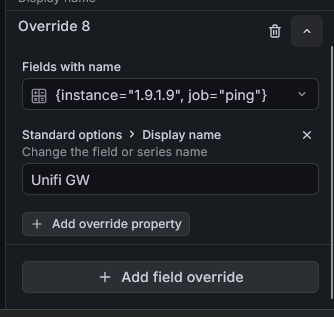
Result
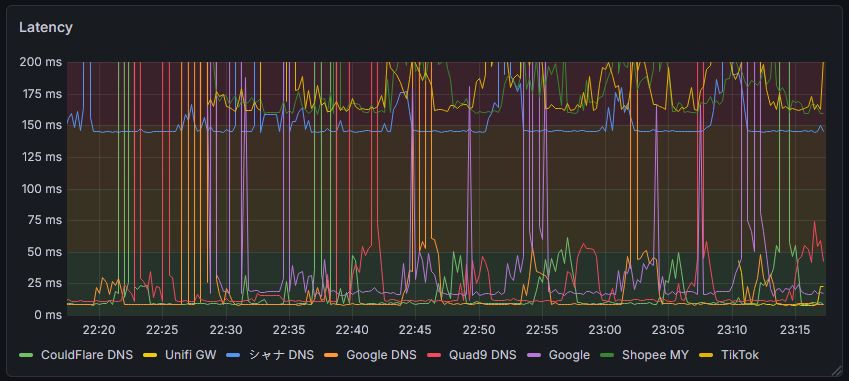
You now have real-time ping monitoring inside Grafana.
Typical monitoring targets include:
1.1.1.1      Cloudflare DNS
8.8.8.8      Google DNS
9.9.9.9      Quad9 DNS
This setup allows you to monitor:
- network latency
- connectivity issues
- upstream network problems